Best and Worst States To Retire In
Choosing where to spend your retirement can be an intimidating task, so we’ve crunched the numbers to calculate the best and worst states for you to retire in 2023. Experts also weigh in with useful tips for finding the right retirement location for you.
- Written by Christian Simmons
Christian Simmons
Financial Writer
Christian Simmons is a writer for RetireGuide and a member of the Association for Financial Counseling & Planning Education (AFCPE®). He covers Medicare and important retirement topics. Christian is a former winner of a Florida Society of News Editors journalism contest and has written professionally since 2016.
Read More- Edited By
Lamia Chowdhury
Lamia Chowdhury
Financial Editor
Lamia Chowdhury is a financial content editor for RetireGuide and has over three years of marketing experience in the finance industry. She has written copy for both digital and print pieces ranging from blogs, radio scripts and search ads to billboards, brochures, mailers and more.
Read More- Financially Reviewed By
Stephen Kates, CFP®
Stephen Kates, CFP®
Certified Financial Planner™ Professional and Founder of Clocktower Financial Consulting
Stephen Kates is a Certified Financial Planner™ professional and personal finance expert with over a decade of experience working with individuals and families who need help with their finances. With experience as a financial advisor for two of the largest financial firms in the country, Stephen has worked with hundreds of clients to build comprehensive financial plans to grow and protect their wealth.
Read More- Published: November 9, 2020
- Updated: May 24, 2023
- 12 min read time
- This page features 18 Cited Research Articles
What Are the Best and Worst States To Retire In?
Research reveals that most Americans hope to stop working by the age of 62. Pair that with the fact that one-quarter of the country’s labor force is projected to be 55 or older by the year 2030, and it becomes clear that a significant proportion of the U.S. population is looking forward to their dream retirement.
In an effort to make the perfect retirement a reality, we put together a data study, ranking all 50 states to identify the best and worst states for retirement in 2023.
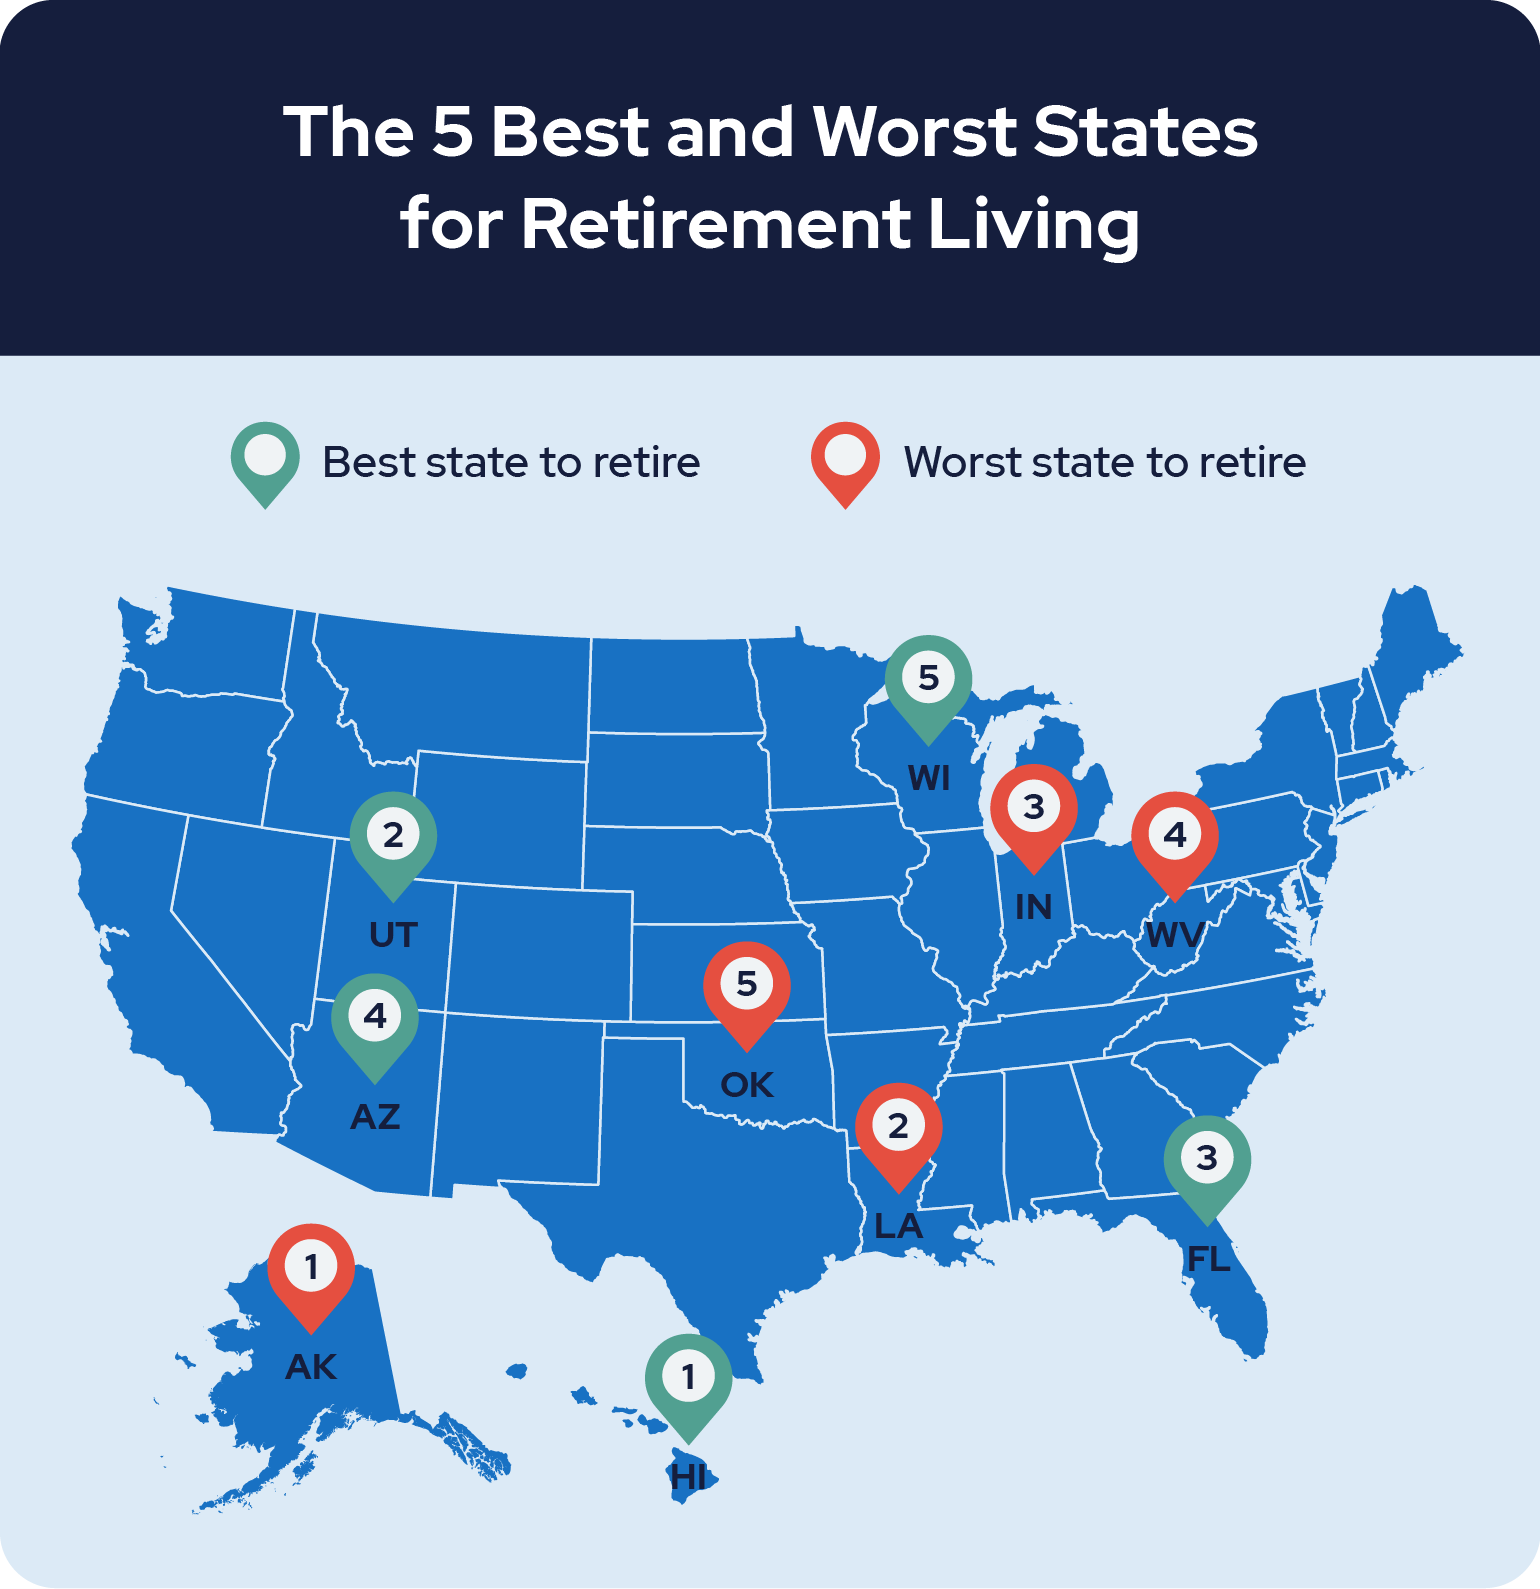
Our results show that the best states to retire in are:
- Hawaii
- Utah
- Florida
- Arizona
- Wisconsin
The worst states to retire in are:
- Alaska
- Louisiana
- Indiana
- West Virginia
- Oklahoma
To calculate these rankings, we used 13 different metrics across three categories — health, housing and quality of life — pulled from publicly accessible databases to rank all 50 states. Each data point our research measured represents an important element of retirement living:
Health- Overall health care rating
- Mental health rankings
- Population of adults over 65
- Average life expectancy
Housing- Rate of renters and homeowners paying over 30% of income for housing
- Home appreciation rates
- Average assisted living costs
Quality of life- Cost of living index ranking
- Community Well-Being Index Scores
- Average daily temperature
- Retirement income per capita for ages 65+
- Percentage of population living in poverty
Our findings reveal that two very different states came out on top and on the bottom. From popular sunny beaches to isolated snowy wilderness, the rankings below provide insight into finding the right state for your retirement.
Is Your Lifestyle Future-Proofed?Secure the lifestyle you've always imagined post-retirement. Discover annuity options that can make it a reality.
*Ad: Clicking will take you to our partner Annuity.org.5 Best States for Retirees
The top five states on our list span the country and offer up a diverse array of outdoor activities, beautiful landscapes and overall quality of life.
1. Hawaii
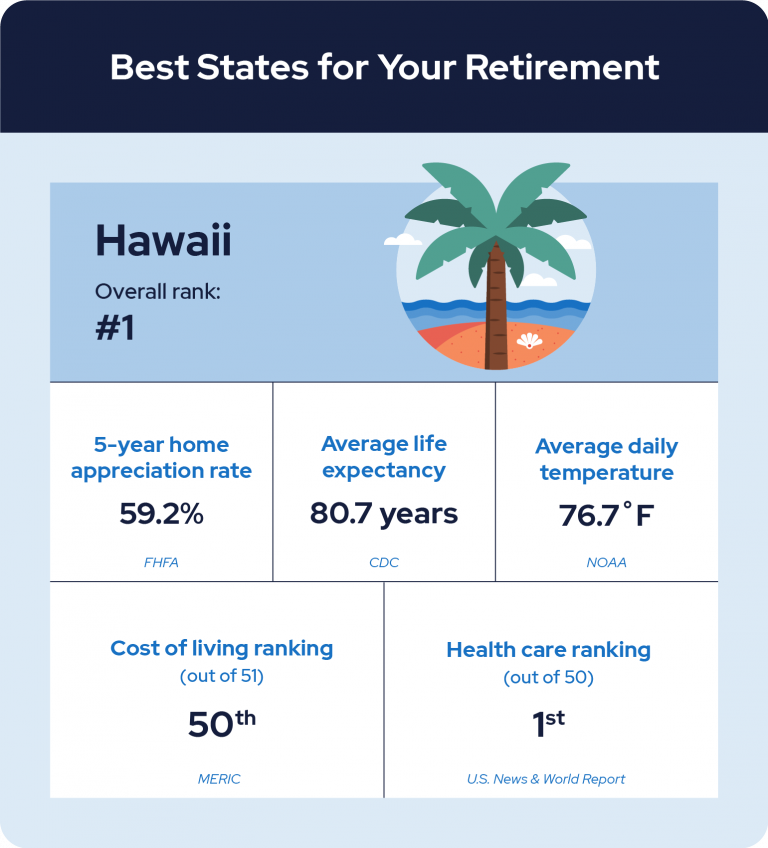
The top spot on our list goes to the tropical paradise that is Hawaii. The island state scored high in the rankings thanks to having the most temperate climate in America, averaging a daily temperature of 76.7ºF over the past year. It was also cited as having the best health care in the country by U.S. News & World Report, with strong performances in both health care access and quality. And the Community Well-Being Index ranked it as the second happiest state in the nation.
Even though residents live longer in Hawaii than anywhere else in America, the state is not without its challenges for retirees. It offers the highest cost of living among all 50 states and also ranks among the worst rates in cost-burdened housing. The U.S. Department of Housing and Urban Development defines cost-burdened homes as those where the residents pay more than 30% of their income toward housing. That issue may be partially mitigated by the fact that the average aggregated retirement income per capita for each Hawaiian resident over 65 is the sixth best in the country at $19,080.61.
2. Utah
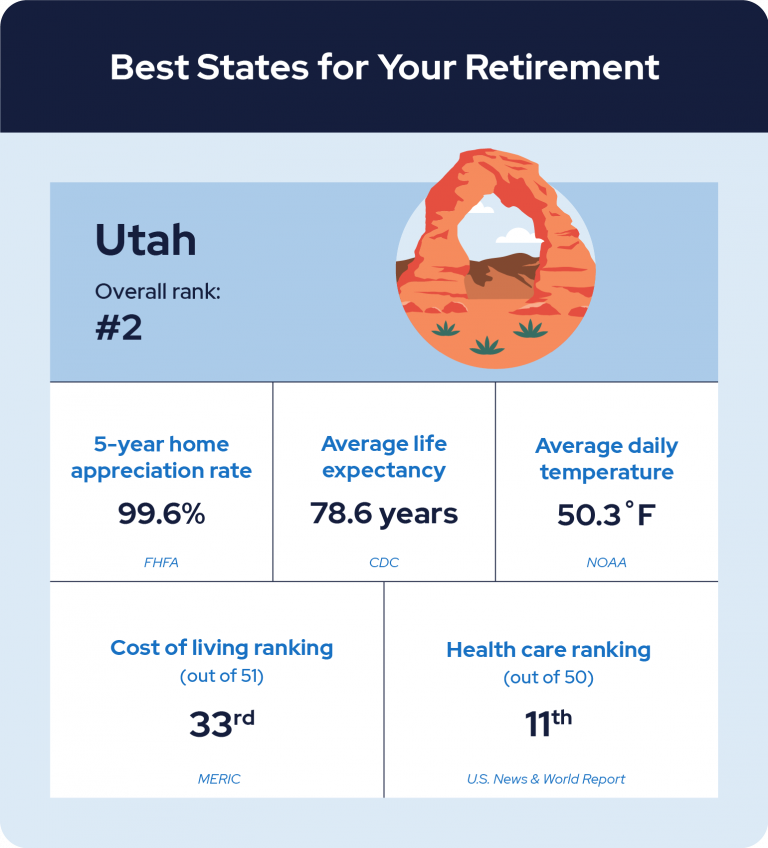
The state of Utah comes in at #2 on our list with a low poverty rate (7.4%) and solid rankings in health care (#11) and community well-being (#10). On average, people in Utah are projected to live to 78.6 years of age — the ninth best life expectancy in the U.S. Therefore, it’s beneficial that Utah also offers the country’s fifth lowest average monthly costs for assisted living services at $3,500.
3. Florida
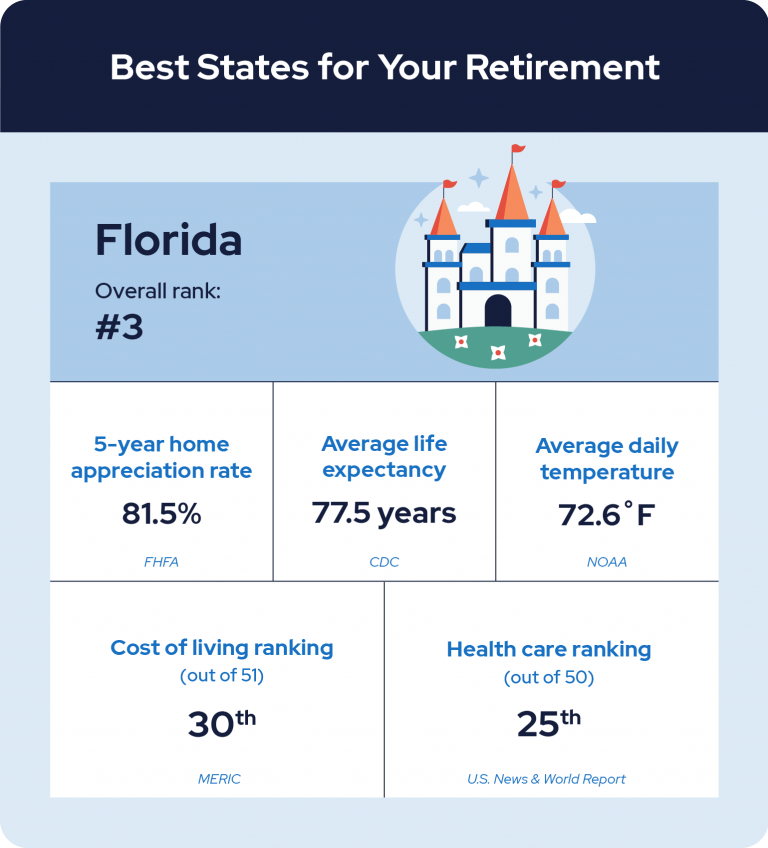
The Sunshine State is home to the second largest proportion of adults over 65 in the country, accounting for 21.3% of all Floridians. The year-round warm temperatures, averaging 72.6ºF over the past year, are second only to Hawaii. Florida ranks respectably in the middle of the pack for several other key factors such as life expectancy (ranked #19), health care (#25), mental health care (#25) and cost of living (#30). The state also has the honor of ranking #1 on our list of the best states for military retirees.
4. Arizona
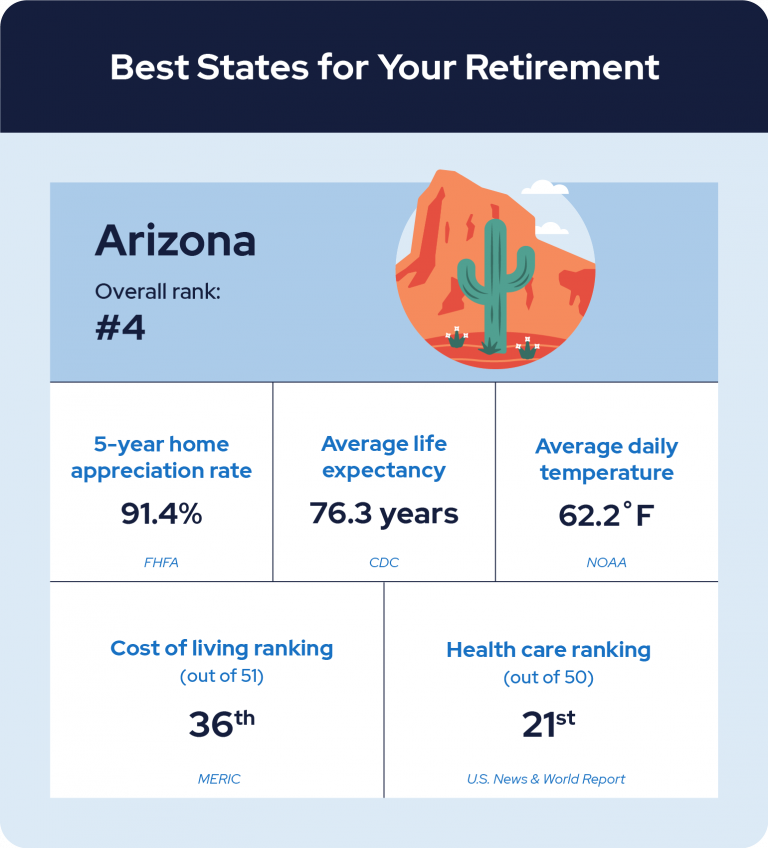
The warm desert climate of Arizona helped propel the state into the #4 position on our list for retirees. The state’s stats hold up well when comparing them against other states. Arizona health care ranks #21 and the overall Community Well-Being Index ranks it as 25 out of 50. The state’s aggregate retirement income ranks #23 at $16,158.08, which is important considering the state’s average monthly assisted living costs are approximately $4,000.
5. Wisconsin
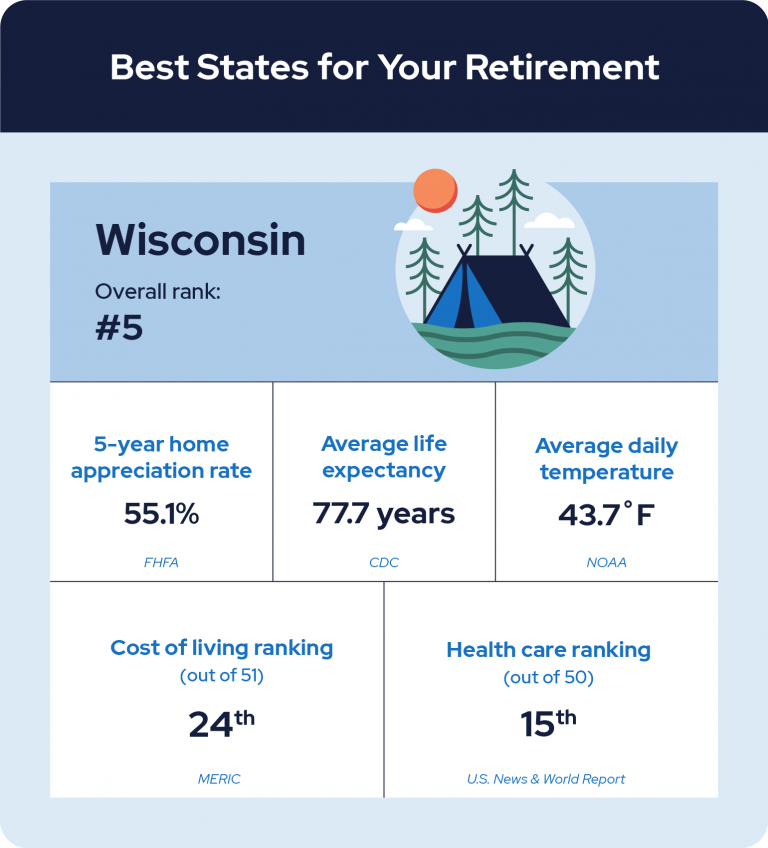
The colder weather found in Wisconsin shouldn’t deter retirees from considering it as an ideal location. Mental Health America identified it as having the second best mental health in the country based on lower incidences of mental illness and higher rates of access to care for adults. Also ranking in the top 30% for both overall health care and the average age of life expectancy, Wisconsin offers a lot of appeal for retirees. The state also boasts a good proportion of older adults, with those over 65 making up 18% of the population.
0:40 The Best and Worst States to Retire In Never Miss Important News or UpdatesReplay VideoLearn how we determined the best and worst states for retiring, and expert tips for your retirement move.
Expert Tips on Choosing the Right State for Your Retirement
A wide variety of factors beyond the ones we reviewed for this study may be important in your retirement planning process. We spoke with experts across the country for a few additional tips on factors worth considering.
Tip 1: Research the Tax Environment
States With Highest and Lowest Income Taxes5 Highest Marginal Income Tax Rates 5 Lowest Marginal Income Tax Rates States With No Income Tax 1. California - 13.3% 1. North Dakota - 2.9% Alaska 2. Hawaii - 11% 2. Pennsylvania - 3.07% Florida 3. New York - 10.9% 3. Indiana - 3.23% Nevada 4. New Jersey - 10.75% 4. Ohio - 3.99% South Dakota 5. Oregon - 9.9% 5. Louisiana/Michigan (tie) - 4.25% Tennessee Texas Wyoming Source: Tax FoundationDoug Carey, the owner and president of WealthTrace in Indiana, has 28 years of experience in the finance industry. He points out the importance of reviewing the tax policies in each state:
“This is a big factor for most people when determining which state to live in. There are four states that do not tax retirement income. They are Hawaii, Illinois, Mississippi and Pennsylvania. Many other states exempt some retirement and pension income. And most states exempt Social Security benefits. Plus, the following states have no state income tax at all: Alaska, Florida, Nevada, South Dakota, Texas, Tennessee, Washington and Wyoming.
But it’s also important to keep in mind that many states with lower income tax rates make up for it with higher property taxes. So it is wise to take into account all taxes before deciding where to move in retirement.”
Retirement planner Andy Gerhartz, a partner at Bridge the Gap Retirement Planners in California, also offers an important reminder about property taxes:
“If you are or plan to be a homeowner in retirement make sure you understand the property tax situation of the particular state you're interested in. Property tax rates vary greatly in this country, and this could either be an area of savings or a big annual expense depending upon where you end up living. Even if your mortgage is paid off, property taxes don't go away. Make sure it's within your budget.”Best States To Retire Tax-WiseConsidering that 91% of Americans are unaware that Medicare premiums are tax-deductible, taking time to better understand the tax implications of relocating to another state makes sense.
Tip 2: Confirm Availability of Health Insurance and Relevant Medical Care
States With Highest and Lowest Average Monthly Medicare Advantage Premiums in 2023Highest Lowest Minnesota - $70.77 Alaska - $0.00 Massachusetts - $44.26 Nevada - $3.58 Hawaii - $43.72 Kansas - $6.17 Wyoming - $36.46 Missouri - $7.67 North Dakota - $35.86 Texas - $8.94 Colorado-based investment advisor Kevin T. Taylor is the managing partner at InSight. He encourages retirees to think about the accessibility of important medical care:
“It’s no surprise that aging comes with health concerns. But financially speaking, it's important to know that wherever you retire there will be timely access to routine and emergency medical treatments. The usually unaccounted-for costs of driving hours to visit a specialist add up, and unfortunately can result in people forgoing needed medical treatments. Accounting for where you will get your medical treatments is as important as knowing if you are covered by insurance for the treatment.”Bill Ryze, a Fiona Chartered Financial Consultant out of Tennessee, suggests paying close attention to the question of health insurance when contemplating a move:
“You will need more medical care in your retirement than before, especially if you have underlying conditions. So it is very important to consider health insurance and its cost. For example, if you plan on taking early retirement, you might not be eligible for Medicare and need to get health insurance coverage until you reach 65. Usually, the cost of health insurance will vary depending on the state. So choose a state whose cost of health insurance is affordable to you.”It’s also important to gain an understanding of how moving may impact your Medicare coverage.
Tip 3: Consider the Proximity to Family, Friends and Your Favorite Activities
RETIREMENT LIFESTYLE QUIZTake the Retirement Lifestyle Quiz to identify the ideal retirement plans for you.With 30 years of financial advice experience, financial coach Michael Ryan of MichaelRyanMoney.com shares a simple but important tip:
“Retirement is a great time to spend more time with loved ones. If you have family or friends spread out across the country, consider choosing a retirement location that is centrally located so you can easily visit them.”And David Edmisten, the founder and lead advisor at Next Phase Financial Planning, LLC in Arizona, agrees:
“I find a lot of people plan retirement based on financial considerations. But one of the biggest regrets reported by retirees is not spending enough time with the people they care about most. Start first with the people you love- children, grandchildren, close friends, and relatives. Where do they live? How often would you like to see them? It may make sense to choose to live in the same state as your important loved ones, or near enough to drive or have a short flight to visit.
Also, give a lot of consideration to how you like to spend your time. Do you love outdoor adventures? Do you prefer the energy and activities found in a large metropolitan area? Do you prefer a quiet life on your own land? Whatever your preference, you’ll want to choose to live in an area where you can easily do the things you love to do the most. You’ll find more satisfaction in retirement if you live in an area where it is easy to be active and engaged in the things that are most important to you.”
As you strategize for a successful retirement, connect with retirement planners and Medicare experts to provide additional insights and advice for creating a plan that best suits your needs.
Beat the Bank With Fixed Annuity Rates As High As 6%Start with a zero-commitment conversation to learn how annuities can help fund your retirement.
*Ad: Clicking will take you to our partner Annuity.org.5 Worst States for Retirement
On the flip side of the many warm states landing atop our best list, the often-frigid state of Alaska has the dubious honor of leading our worst states for retirees. A drastic difference from the top state of Hawaii, Alaska has the lowest average daily temperature of any state at 27.7ºF. It also boasts the highest costs for assisted living, averaging $6,830 a month, and the worst five-year home appreciation rate in the country, at only 29.1%.
The other states ranked among the worst for retirement include:- Alaska
- Louisiana
- Indiana
- West Virginia
- Oklahoma
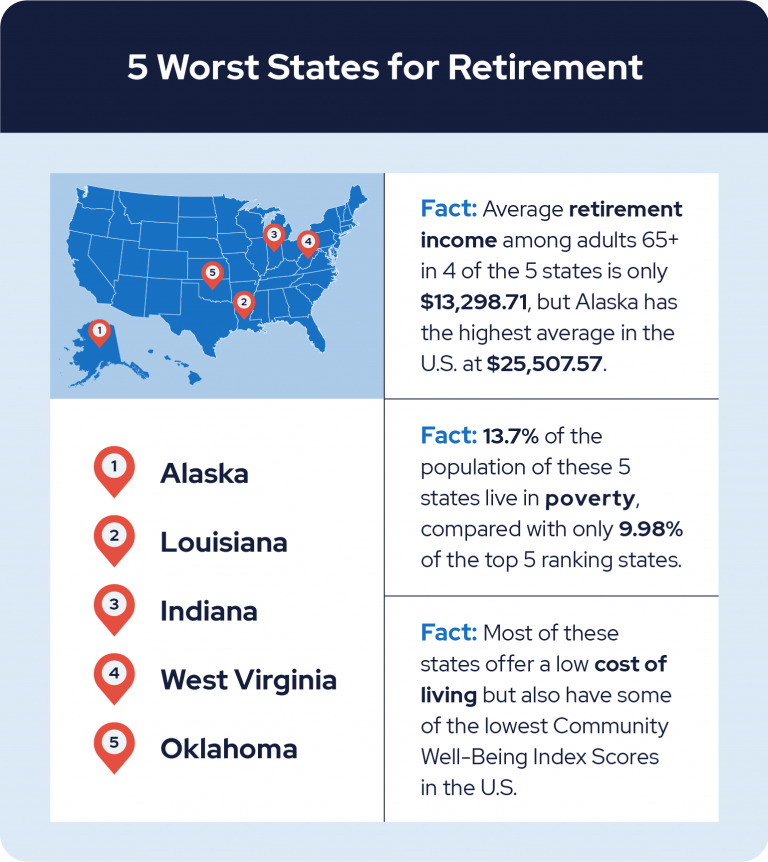
The majority of these states actually offer low cost of living, which can be a huge benefit to retirees living on limited budgets. But these states also feature some of the lowest Community Well-Being Index Scores in the country. For example, Oklahoma has the second best cost of living rate in the country, but is ranked 43rd in terms of residents’ overall happiness.
Access to quality health care is a critical need for most adults as we age. The states ranking lowest on our list suffer from poor performance in the health care arena. In particular, Louisiana, West Virginia and Oklahoma are some of the worst states in terms of overall health care, nationally ranking 46th, 47th and 48th, respectively.
While West Virginia is home to the nation’s third largest ratio of adults over 65 at 20.9% of the population, it simultaneously has the second lowest average life expectancy in America at just 72.8 years. A lack of accessible quality health care options can have a major impact on an individual’s life span.
Another factor in quality of life and average life expectancy is the prevalence of poverty. Of the five lowest-ranked states on our list, 13.7% of their cumulative population lives in poverty, compared to only 9.98% of the top five ranking states. Louisiana, which ranked as the second worst state to retire in, has one of the worst poverty rates in the country: 17.2% of its population lives at or below the poverty line.
Surviving on limited finances requires both careful retirement planning and making smart use of benefits and discounts available to seniors. The average aggregate retirement income among adults over 65 in four of these five low-ranking states is only $13,298.71. Decreased financial stability can cause major impacts to a person’s overall health and well-being. It’s interesting to note that Alaska is the one outlier with the highest average retirement income in the U.S. at $25,507.57.
3 Minute Quiz: Can You Retire Comfortably?Take our free quiz & match with a financial advisor in 3 easy steps. Tailored to your goals. Near you or online.Ranking All 50 States for Retirement Living
By examining important statistics impacting the lives of retirees across the country, our calculations have revealed the rankings for every state in America.
How does your current state of residence rank for retirees?- Hawaii
- Utah
- Florida
- Arizona
- Wisconsin
- Connecticut
- South Carolina
- Illinois
- New Jersey
- Rhode Island
- Virginia
- Idaho
- Pennsylvania
- Colorado
- Iowa
- New Hampshire
- Washington
- Minnesota
- South Dakota
- Maryland
- Massachusetts
- Georgia
- Delaware
- Wyoming
- Alabama
- Nebraska
- Montana
- Missouri
- North Carolina
- Michigan
- Tennessee
- Oregon
- Kansas
- Vermont
- Nevada
- Texas
- California
- Kentucky
- New York
- Ohio
- New Mexico
- Arkansas
- North Dakota
- Maine
- Mississippi
- Oklahoma
- West Virginia
- Indiana
- Louisiana
- Alaska
Identifying the perfect location for your retirement can be daunting. This ranking of the best states to retire in is a useful starting point. Once you’ve identified some states to consider, you can explore potential costs tailored to you by using helpful tools such as the Retirement Community & Assisted Living Calculator and the Elder Index, which measures the income older adults need to live independently.
Methodology
Our research team collected, calculated and compared 13 data points to rank all 50 states to identify the best and worst places for American retirees to live (excluding Washington, D.C., due to unavailable data metrics). Each state was ranked on a weighted scale according to the following guide:
Health - 30%- Overall health care rating - 10 points
- Mental health rankings - 5 points
- Population of adults over 65 - 10 points
- Average life expectancy - 5 points
Housing - 25%- Rate of renters and homeowners paying over 30% of income for housing - 5 points
- Home appreciation rates - 10 points
- Average assisted living costs - 10 points
Quality of Life - 45%- Cost of living index - 15 points
- Community Well-Being Index Scores - 10 points
- Climate (average daily temperature) - 5 points
- Retirement income per capita for ages 65+ - 10 points
- Percentage of population living in poverty - 5 points
The data used in the health category calculations was extracted from the Population Reference Bureau, Mental Health America, U.S. News & World Report and the CDC. The housing statistics were pulled from the Federal Housing Finance Agency, Harvard’s Joint Center for Housing Studies and the Genworth Cost of Care Survey. Quality of life metrics were gathered from the Missouri Economic Research and Information Center, ShareCare’s Community Well-Being Index, the NOAA’s National Centers for Environmental Information and the U.S. Census Bureau.
Last Modified: May 24, 2023Share This Page Christian Simmons Financial WriterChristian Simmons is a writer for RetireGuide and a member of the Association for Financial Counseling & Planning Education (AFCPE®). He covers Medicare and important retirement topics for RetireGuide. His unique blend of business and writing backgrounds has equipped him to understand complex retirement topics and convey that information in an informed and easily digestible way.
- Certified educator in personal finance
- Bachelor’s degree in journalism from the University of Central Florida Burnett Honors College
- Master’s degree in integrated business from the University of Central Florida
Edited By Lamia Chowdhury Financial EditorFinancially Reviewed By
 Stephen Kates, CFP® Certified Financial Planner™ Professional and Founder of Clocktower Financial Consulting
18 Cited Research Articles
- CDC. (2022, August 24). Life Expectancy at Birth by State. Retrieved from https://www.cdc.gov/nchs/pressroom/sosmap/life_expectancy/life_expectancy.htm
- Centers for Medicare and Medicaid Services. (2022, September 29). 2023 Medicare Advantage and Part D State Fact Sheets. Retrieved from https://www.cms.gov/files/document/2023-medicare-advantage-and-part-d-state-state-fact-sheets.pdf
- Creamer, J. et. al. (2022, September 13). Poverty in the United States: 2021. Retrieved from https://www.census.gov/data/tables/2022/demo/income-poverty/p60-277.html
- Federal Housing Finance Agency. (2022). Change in FHFA State House Price Indexes (Seasonally Adjusted, Purchase-Only Index, 2022Q1). Retrieved from https://www.fhfa.gov/DataTools/Tools/Pages/House-Price-Index-(HPI).aspx
- Hoyt, J. (2022, August 10). How Much Does Assisted Living and Home Care Cost in the U.S.? Retrieved from https://www.seniorliving.org/assisted-living/costs/
- HUD. (n.d.). Rental Burdens: Rethinking Affordability Measures. Retrieved from https://www.huduser.gov/portal/pdredge/pdr_edge_featd_article_092214.html
- Joint Center for Housing Studies. (2022). The State of the Nation’s Housing 2022. Retrieved from https://www.jchs.harvard.edu/state-nations-housing-2022
- Kilduff, L. (2021, December 22). Which U.S. States Have the Oldest Populations? Retrieved from https://www.prb.org/resources/which-us-states-are-the-oldest/
- Konish, Lorie. (2022, January 3). Here is the age when many Americans hope to retire. Retrieved from https://www.cnbc.com/2022/01/03/here-is-the-age-when-many-americans-hope-to-retire.html
- Mental Health America. (2022). Adult Ranking 2022. Retrieved from https://www.mhanational.org/issues/2022/ranking-states
- Missouri Economic Research and Information Center. (2022). Cost of Living Data Series. Retrieved from https://meric.mo.gov/data/cost-living-data-series
- NOAA National Centers for Environmental information. (2022, October). Climate at a Glance: Statewide Mapping, Average Temperature. Retrieved from https://www.ncei.noaa.gov/access/monitoring/climate-at-a-glance/statewide/mapping/110/tavg/202209/12/value
- ShareCare. (2022). Community Well-Being Index. Retrieved from https://wellbeingindex.sharecare.com/interactive-map/
- U.S. Census Bureau. (n.d.). Aggregate Retirement Income in the past 12 Months (In 2021 Inflation-Adjusted Dollars) for Households. Retrieved from https://data.census.gov/cedsci/table?q=B19069%3A%20AGGREGATE%20RETIREMENT%20INCOME%20IN%20THE%20PAST%2012%20MONTHS%20%28IN%202021%20INFLATION-ADJUSTED%20DOLLARS%29%20FOR%20HOUSEHOLDS&g=0100000US_0400000US01,02,04,05,06,08,09,10,11,12,13,15,16,17,18,19,20,21,22,23,24,25,26,27,28,29,30,31,32,33,34,35,36,37,38,39,40,41,42,44,45,46,47,48,49,50,51,53,54,55,56&tid=ACSDT1Y2021.B19069&moe=false&tp=true
- U.S. News & World Report. (2022). Health Care Rankings. Retrieved from https://www.usnews.com/news/best-states/rankings/health-care
- Vermeer, T. et al. (2022, February 15). State Individual Income Tax Rates and Brackets for 2022. Retrieved from https://taxfoundation.org/state-income-tax-rates-2022/#Current
- Waggoner, J. (2022, March 9). 9 States That Don't Have an Income Tax. Retrieved from https://www.aarp.org/money/taxes/info-2020/states-without-an-income-tax.html
- Wince-Smith, Deborah. (2022, February 25). Bracing For The Silver Tsunami. Retrieved from https://www.forbes.com/sites/deborahwince-smith/2022/02/25/bracing-for-the-silver-tsunami/?sh=2f4c47ab33e4
- Edited By
Calling this number connects you to one of our trusted partners.
If you're interested in help navigating your options, a representative will provide you with a free, no-obligation consultation.
Our partners are committed to excellent customer service. They can match you with a qualified professional for your unique objectives.
We/Our Partners do not offer every plan available in your area. Any information provided is limited to those plans offered in your area. Please contact Medicare.gov or 1-800-MEDICARE to get information on all of your options.
844-359-1705Your web browser is no longer supported by Microsoft. Update your browser for more security, speed and compatibility.
If you need help pricing and building your medicare plan, call us at 844-572-0696